


Carbon footprint calculator
Last update: May 2011
We all know that certain choices use energy and cause pollution, but how do those things stack up against each other? For example, do you prevent more pollution by ditching your car or by going vegetarian? And how does the energy you save in your home compare to the energy you save by not taking a certain airline flight?
I wanted to know, and I found the other online calculators didn't answer that question well, so I spent a solid week researching the data and creating the calculator below. So give the calculator a whirl and see how you stack up!
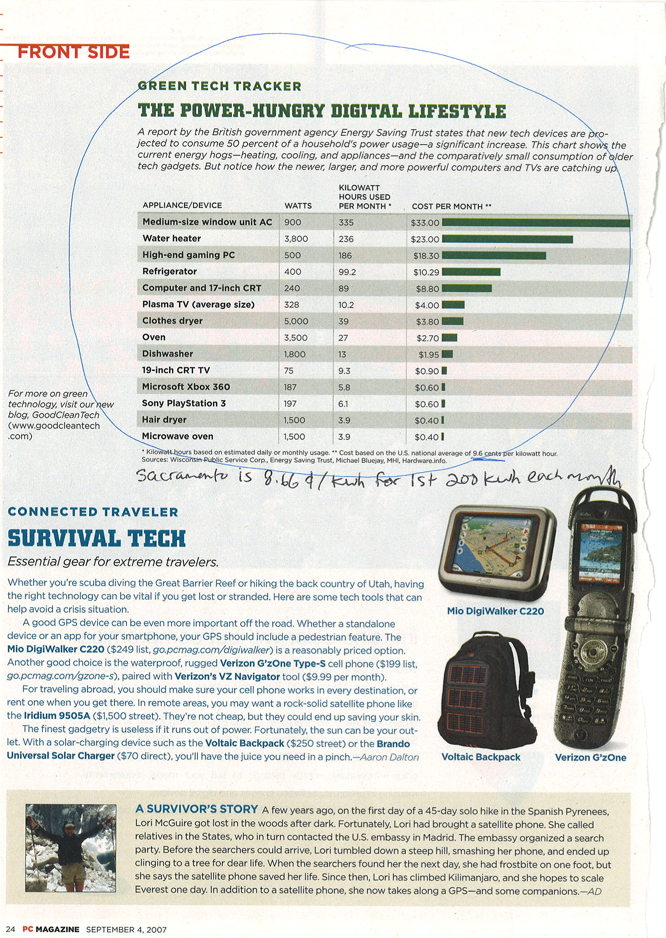
Electricity matters because most electricity in the U.S. is generated by burning coal. Coal-burning causes tremendous pollution, and is a powerful contributor to climate change. As a result, the coal industry has been touting what they call "Clean Coal", which is little more than a marketing ploy. There is no such thing as clean coal.
You'll also note from the calculator that your house has a bigger effect on the climate than your car! That's why I put home energy first in the calculator.
Electricity used in different parts of the country creates different amounts of pollution, because some places get a larger share of their electricity from coal. But this calculator keeps things simple by using U.S. averages for pollution caused by electricity.
You'll get the most accurate answer by entering in the number of kWh you use (which you can find on your electric bill) rather than cost per month, since the cost of electricity in the U.S. varies widely from one area to another (7¢ to 30¢ per kWh as I write this). If you enter $/mo. then I first subtract $10 to estimate the fixed cost that the utility charges you each month for the privilege of being their customer, and then figure the rest was for energy at 11¢/kWh, the national average.
The average U.S. household uses 920 kWh per year of electricity. I assume that single-person households use half that. (There are 2.67 people per household, but I don't divide by 2.67 because I want to account for the fact that multi-person households are more efficient. If I divide average household use by 2.67 then I'll understate the individual's use. For example, both a 3-person household and a 1-person household will each have one refrigerator, so the fridge in the 1-person house uses more energy per person.)
On a separate page I have complete sources, references, and calculations.
If you know your fixed monthly charge is higher or lower than $10, you can account for that to get a better estimate from the calculator. For example, let's say you enter in $14. The calculator subtracts $10 and figures you bought $4 worth of gas. But say the gas company charges you only $8/mo. to be a customer. In that case you really used $6 worth of gas ($14 - 8). So to get the calculator to figure you bought $6 worth of gas, enter in $16, and it will subtract $10, leaving $6.
Only 64 million of the nation's 107 million households use natural gas. Of those using gas, they use 688 therms per year on average, or 57.3 therms per month. To come up with the default figure for single-person households, I assume they use half of what a typical household uses. (There are 2.67 people per household, but I don't divide by 2.67 because I want to account for the fact that multi-person households are more efficient. If I divide average household use by 2.67 then I'll understate the individual's use. For example, both a 3-person household and a 1-person household will each have one hot water heater, but the water heater likely won't use 3x as much energy in the 3-person household, so the heater in the 1-person household uses a little more energy per person.)
To figure the tons of carbon from the average household and the average person for the right-hand column, I divide the total amount of carbon generated by natural gas by the total number of households (107 million) and the total number of people in the U.S. (300 million), respectively.
On a separate page I have complete sources, references, and calculations.
You can enter your heating oil usage either as the amount you pay per month, or the number of gallons you use per month (which you can get from your bill). If you enter the cost, then I first subtract $10 as an estimate of the fixed cost your oil company charges you no matter what, then figure that the rest was charged at $4.00/gallon.
If you know your fixed monthly charge is higher or lower than $10, you can account for that to get a better estimate from the calculator. For example, let's say you enter in $14. The calculator subtracts $10 and figures you bought $4 worth of oil. But say the oil company charges you only $8/mo. to be a customer. In that case you really used $6 worth of oil ($14 - 8). So to get the calculator to figure you bought $6 worth of oil, enter in $16, and it will subtract $10, leaving $6.
Only 8.1 million of the nation's 107 million households use fuel oil. Of those using oil, they use 889 gallons per year on average, or 74 gallons per month. To come up with the default figure for single-person households, I assume they use half of what a typical household uses. (There are 2.67 people per household, but I don't divide by 2.67 because I want to account for the fact that multi-person households are more efficient. If I divide average household use by 2.67 then I'll understate the individual's use. For example, both a 3-person household and a 1-person household have a furnace, but the furnace likely won't use 3x as much energy in the 3-person household, so the heater in the 1-person household uses a little more energy per person.)
To figure the tons of carbon from the average household and the average person for the right-hand column, I divide the total amount of carbon generated by fuel oil by the total number of households (107 million) and the total number of people in the U.S. (300 million), respectively.
On a separate page I have complete sources, references, and calculations.
As you can see from the calculator, the average home pollutes more than the average car.
The EPA reports the average fuel economy of the U.S. fleet as 22.2 mpg, but actual fuel economy is only 20.36, as listed in the sources section. Therefore, for whatever MPG you enter, the calculator assumes your car gets only 91.7% of that.
There are 107 million households in the U.S. but only 99 million have a car. Of those with a car, they use 1,141 gallons of gas per year on average, or 95 gallons per month. To come up with the default figure per person, I divided the total miles traveled (2.3 trillion) by average MPG (20.36) and divided again by the number of drivers in the U.S. (196 million), for 591 gallons per person. I also use this in the right-hand column to come up with the amount of carbon generated by an individual's driving.
On a separate page I have complete sources, references, and calculations.
Most people are surprised to learn that the typical diet (what people normally eat) uses twice as much energy to produce than a typical vegan diet -- and therefore twice as much energy-related pollution.
The reason is that livestock are food factories in reverse: We put about 14 times more food into a steer than we get out of it. So we're running 14x as many tractors, using 14x as much labor, flying 14x as many crop-spraying planes, etc. (The reasons a typical diet uses only twice as much as a meatless diet instead of 14x are that other meats aren't quite as inefficient as beef, and that meat-eaters also eat plant foods.) Here's how energy-intensive beef is: It takes 145 times more energy to produce beef than potatoes.
Grass-fed beef is not the answer for a whole host of reasons, the most important being that there is not nearly enough grazing land in the U.S. to raise as much beef as Americans currently eat.
Food choices are so important that the typical American could save more much carbon by going vegetarian than by giving up flying. Vegans do even better, saving twice as much carbon. (source) That's why I list Food higher in the calculator than flying. It's also one of the easier lifestyle factors to change. It's easy to choose a bean burrito instead of a hamburger. It's not as easy to get from New York to California without flying.
One buzzword these days is buying locally-produced food, so that it takes less energy to transport. While it can't hurt to buy local, it's a small drop in the bucket compared to the effect as going vegetarian or vegan. Transportation of food to the store accounts for only 4% of the greenhouse emissionsn involved in producing the food. A scientist who analyzed food energy in a research paper concludes, "Buying local is not as important as what you eat." In other words, it's much, much better to buy a pound of carrots shipped from far away than a pound of locally-produced beef. (New Scientist reviews the research paper, Actual research paper, source for the quote)
For the calculator, I assume that kids eat 60% as many calories as adults (and therefore create 60% as much carbon).
On a separate page I have complete sources, references, and calculations.
The calculator asks for hours of flight rather than miles because most people have a better idea of how many hours they've flown than how many miles. The calculator averages the number of miles you took per trip, since shorter flights use more energy per mile than longer ones.
It's no surprise that planes use huge amounts of energy -- and thus produce huge amounts of climate-changing gases. The airlines are on the defensive about this and in their in-flight magazines you will see big full-page glossy ads touting their energy efficiency initiatives. What they're not telling you is that such changes make only a 2% difference at best.
Most carbon calculators fail to include radiative forcing (RF) and thus underestimate the impact of flying by a factor of 1.9. RF basically means that the damage caused by planes is greater than normal because the pollution happens up in the sky. This calculator is one of the few to account for RF. RF is explained in more detail in pp. 26-27 a Dec. 2006 PDF report from Tufts University, which states:
"To estimate the impact of an airplane trip a multiplier should be used on the CO2 emissions from jet fuel to account for full radiative forcing.... Although more research is needed to fully understand the chemical processes in the stratosphere, the research used by the IPCC is robust. We therefore recommend using a calculator that includes a multiplier for the increased radiative forcing in its carbon calculations."
Alternatives to flying include:
- Taking a train or bus
- Taking a cargo ship. (I've done that very thing, traveling
across the Atlantic Ocean by boat.)
- Vacationing closer to home
- Taking fewer trips, but staying for longer
periods of time
- Teleconferencing instead of face-to-face
business meetings
Would people consider not flying to save the environment? Sure they would. A BBC poll found that over half would do so.
In fact, most Americans already don't fly. In a given year, only 43% of Americans take a plane. That number will surely decrease as airlines respond to increased fuel costs by cutting flights left and right (making travel less convenient) and raising airfares substantially.
If you can't give up flying, let me give you an out: the typical American could save as much carbon by going vegetarian than by giving up flying. Vegans do even better, saving twice as much carbon as flying. (source)
Many people come to this page looking for an answer to the question, "Which is worse: driving or flying?" The answer is flying. Planes effectively get only 22.6 passenger miles per gallon when considering their special contributions to climate change. That's less than just about any car.
The default shown for flying by household is equivalent to the total number of passenger-miles flown (848 billion miles) divided by 107 million households, multiplied by the percentage of trips that are personal (non-business), which comes out to 5548 miles, which I'm figuring as a 2 round-trips of 1,387 miles each way, which is closest to 13 hours of flying time total.
On a separate page I have complete sources, references, and calculations.
The best way to reduce your carbon footprint is to
use less energy.
(Drive less, fly less, save energy at home, and eat vegetarian.)
The next-best way is to buy carbon offsets.
Tons of carbon
dioxide
emissions per capita
(I got this from the Hinkle Charitable Foundation
which credits the Energy Information Administration,
"International Energy Outlook 2003", but I'm unable to find that
report, or a newer version, on EIA's website.
Wikipedia has a Carbon dioxide emissions per capita by
country article.)
(I got this from the Hinkle Charitable Foundation which credits the Energy Information Administration,
"International Energy Outlook 2003", but I'm unable to find that report, or a newer version, on EIA's website.
Wikipedia has a Carbon dioxide emissions per capita by country article.)
Which actions make the biggest impact
|
Action (one person) |
in one year |
|
Stop driving |
|
|
Slash home energy use |
|
|
Go vegan |
|
|
Stop flying |
|
Note that most people can save twice as much carbon by going vegan than by not flying. This assumes 5.5 hours of flying time per year.
The "reduce home energy use" line assumes using 150 kWh/mo. on average, and no oil or gas. (see sources)
|
|
Transportation Mode |
|
|
Bus |
|
|
Typical U.S. car, 4 people |
|
|
Typical U.S. car, 3 people |
|
|
Airplane, w/o considering extra climate change effect |
|
|
Typical U.S. car, 2 people |
|
|
Airplane, after considering extra climate change effect |
|
|
Typical U.S. car, 1 person |
Flying is worse than driving
Planes get a respectable 43 passenger miles per gallon (pMPG), but they cause 1.9 times as much climate change per gallon of fuel burned, by virtue of their being up in the sky. So when we consider climate change, the plane's efficiency is more like 22.6 pMPG. That's worse than most cars. And if there are two people traveling in the car instead of flying, then the pMPG of the car is doubled, while the plane is stuck at 22.6 pMPG, because we're already figured the plane's pMPG on a per-seat basis. The only time that flying is better than driving for a given trip is if there's only one person in the car, and/or we're assuming a very low-mileage car.
The most efficient way to travel in the U.S. is by bus. Inter-city buses get a whopping 125 pMPG. By contrtast, Amtrak trains get only 45 pMPG (though that could be due to U.S. trains often running very empty). (sources)
Hummer-driving vegans use less energy than meat-eating Prius drivers?
Michael Pollan made that claim, but it's not true. The calculator can help do the comparison. A 10 mpg Hummer driven the U.S. average of 1000 miles/mo. generates 13.4 tons of CO2 per year, vs. 2.7 tons for a 50 mpg Prius, for a penalty of 10.7 tons for driving the Hummer. By contrast, going vegan saves only 2.2 tons/yr. So it isn't even close, it's far worse to drive a Hummer than to eat meat.
But this kind of comparison misses the point: Meat production really is energy-intensive and causes a tremendous amount of unnecessary pollution, it's just that Hummers are even worse. Anyone who's serious about reducing their carbon-, energy-, or pollution-footprint is going to cut back or eliminate meat, especially as it's the low-hanging fruit. Cutting back or going veg is the easiest way for most people to make the biggest dent in their footprint.
Carbon Footprint Calculators Compared
|
Carbon calculators compared |
Michael Bluejay.com |
Nature.org | EPA | Carbon Counter.org |
Carbon Fund | An Inconvenient Truth |
|
Interaction and Results |
|
|||||
|
All data & results viewable on same page |
|
✓ | ✓ | ✓ | ✓ | |
|
Entire calculator viewable without scrolling |
✓ | ✓ | ✓ | |||
|
Shows sample data and results right off the bat with no clicks required |
||||||
|
Compares your (or your household's) results to the typical American (or household), line by line |
(no, but at bottom of page) |
|||||
|
Shows total for each section separately, on the same page |
✓ | ✓ | ||||
| Shows total of all sections | ✓ | ✓ | ✓ | ✓ | ||
|
Achieves brevity by omitting items that are <2 tons per person on average |
✓ | ✓ | ✓ | |||
| Fast | ✓ | ✓ | ||||
| Calculates automatically without having to click a "Calculate" button | ✓ | ✓ | ✓ | ✓ | ||
| No annoying/distracting animations | ✓ | ✓ | ✓ | ✓ | ||
| Results are not wildly inconsistent with other calculators | ✓ | ✓ | ✓ | |||
|
Home Energy |
|
|||||
|
Allows you to enter your exact home energy use |
|
|
|
|
|
|
|
Allows entry of home energy in either energy units or dollars |
|
|
|
|
|
|
|
Clearly shows whether data to be entered is per month or per year |
|
|
|
|
|
|
|
Doesn't require yearly data to be entered (who gets a yearly electric bill?!) |
|
|
|
|
|
|
|
Food & Driving |
|
|||||
|
Includes food section |
|
|
|
|
|
|
|
Shows driving & flying separately |
|
|
|
|
|
|
|
Allows you to enter MPG directly (rather than making you specify four different things about your car so the calculator can guess your MPG) |
|
|
|
|
|
|
|
Air Travel |
||||||
|
Includes air travel |
|
|
|
|
|
|
|
Doesn't restrict you to entering only one single flight |
|
|
|
|
|
|
|
Good estimation of miles flown (not just "# of short & long trips" or "number of hours" [without asking for number of flights]) |
|
|
|
|
|
|
|
Accounts for radiative forcing (i.e., results are not off by a factor of 1.9) |
|
|
|
|
default |
|
|
Other |
|
|||||
|
Sources and calculations provided and explained well (esp. for "average person" figure) |
|
|
|
household figures) |
|
|
|
Activity (tons of CO2) |
(2.67-person household) |
(2-person household) |
(3-person household) |
|
|
Home - Electricity |
|
|
|
|
|
Home - Gas |
|
|
|
|
|
Home - Oil |
|
|
|
|
|
Home - Total |
|
|
|
|
|
Driving |
|
|
|
|
|
Flying |
|
|
|
|
|
Eating |
|
|
|
|
|
Total |
|
(27.7 for 2.67 people) |
(66.8 for 2.67 people) |
|
|
Notes |
|
|
|
|
Carbon Calculators results compared (per individual)
|
Activity (tons of CO2) |
(individual) |
(individual) |
(individual) |
|
Home - Electricity |
|
|
|
|
Home - Gas |
|
|
|
|
Home - Oil |
|
|
|
|
Home - Total |
|
|
|
|
Driving |
|
|
|
|
Flying |
|
|
|
|
Eating |
|
|
|
|
Total |
|
|
|
|
Notes |
|
|
|
Other figures for individuals (U.S./short tons):
- 22.5 tons - United Nations, 2004
- 22 tons - Science Daily
- 21 tons - Carbon Trust, according to an article in The Independent; note that I converted from U.K./long tons
- 8.0 tons - FirmGreen
- 7.5 tons - An Inconvenient Truth
(a) They figure the total independently from the other figures; the total is less than the individual values because the figures for natural gas/oil are only for households that use gas/oil.
(b) Their calculator doesn't include defaults, so I had to enter my own figures, so this total isn't really "their" estimate for household use, since they don't tell us how much they think households use. (They have a sources & references section, but it mixes individual and household data, and we don't know how they'd separate that.)
(c) They cleverly figure the total by dividing the U.S.' carbon output by the entire population. If you add up their line items, their total is 14.1.
(d) Their total is higher than the sum of the line items because they include a section on Household Waste, which I didn't include in the table.